Try the Web App Demo!
See the odds before you commit capital
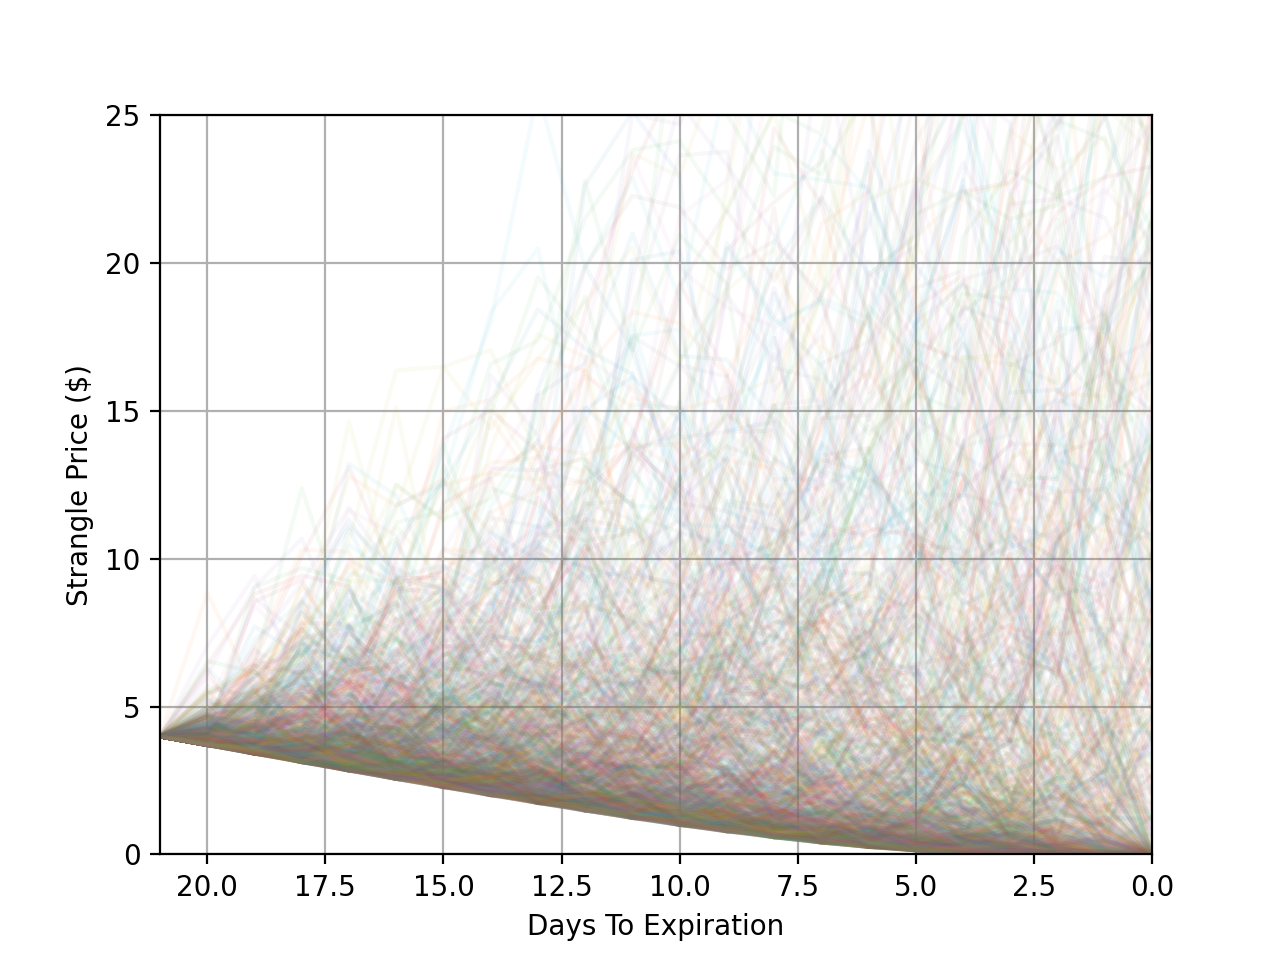
We simulated thousands of possible market paths for a common options income trade to answer three business questions:
- How often do we hit our profit targets?
- How bad can losses get—and how likely are they?
What the simulation says (at a glance)
| Target Profit | Probability | When This Occurs |
|---|---|---|
| 25% | 93% | Any time before expiration |
| 50% | 86% | Any time before expiration |
| 100% | 71% | At expiration |
There’s roughly a 13% chance of a large loss (~2× max profit) if you run the trade without guardrails. That tail risk can be managed with earlier exits and sizing.
What you can do with this
- Take-profit: Close around 45–50% to lock in the high-probability win while avoiding late-stage risk.
- Time stop: Exit by a defined day (e.g., a specific number of days before expiration) if target isn’t reached.
- Position size: Cap unit count so a 2× adverse move stays within your risk budget.